How Engaged Impressions maximize TV advertising performance
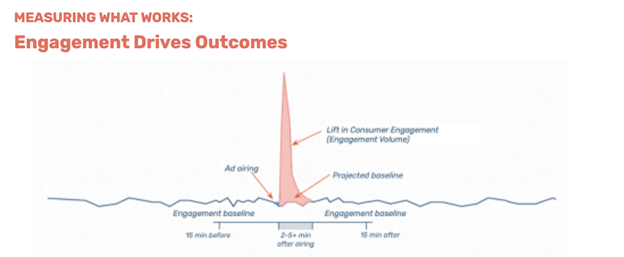
EDO’s TV ad impression metrics are rooted in ad-driven consumer engagement behaviors, and can accurately evaluate impression quality and predict future sales.
A new way to optimize TV ad performance

By combining its brand search engagement metrics with Nielsen’s state-of-the-art measurement of impression quantity, EDO sought to find a way to accurately predict sales lift and drive improved linear TV optimization results. This combined approach is called Balanced Optimization. As its name suggests, it balances three major factors in optimizing media plan return on investment:
- Media Weight (Number of Impressions)
- Media Quality (Consumer Engagement)
- Media Cost

EDO and Nielsen’s metrics get results: For individual clients in private proofs of concept, EDO’s search-based TV efficacy metrics have shown they can predict short-term sales movement. EDO has also shown the direct links between share of search and market share growth in public research efforts, working with the U.K.-based IPA research group.
How Engaged Impressions generated a 280% improvement in consumer engagement
If a brand optimizes only using CPMs and impressions, how does that compare to a balanced optimization strategy that uses a combination of CPMs, impressions, and EDO’s metric of impression quality (ER)? That’s what EDO sought to determine.
EDO compared two basic optimization strategies over the same time period during the first half of 2024 for one leading client, using different optimization target metrics:
1. Nielsen impressions and CPMs only
a. Maximizing total impressions while keeping weekly budget constant
2. Nielsen and EDO combined and CPM
a. Maximizing Engaged Impressions — a metric inclusive of both campaign scale and impression quality — while keeping weekly budget constant
Each model showed estimates of incremental traffic lift, as well as the incremental dollar value of TV ads. The results were eye-popping — while the standard CPM and impression strategy garnered a 5% gain in incremental web traffic from linear advertising, the Nielsen and EDO combined optimization strategy saw a total gain in incremental web traffic of about 19%, or nearly four times the CPM minimization strategy. In other words, this advertiser saw a 280% greater improvement in incremental website visits using EDO and Nielsen’s Balanced Optimization model.
Want to get more insights on EDO’s strategy and learn how to maximize your TV advertising performance? Download EDO’s white paper and see how you can harness the power of Engaged Impressions.
You have questions. We have answers.
Get immediate access to our Insights library.

