
New Evidence Raises Serious Concerns About Nielsen’s BD+P Accuracy
Where can marketers find reliable, accountable audience measurement? Increasingly, not with Nielsen’s Big Data + Panel (BD+P).
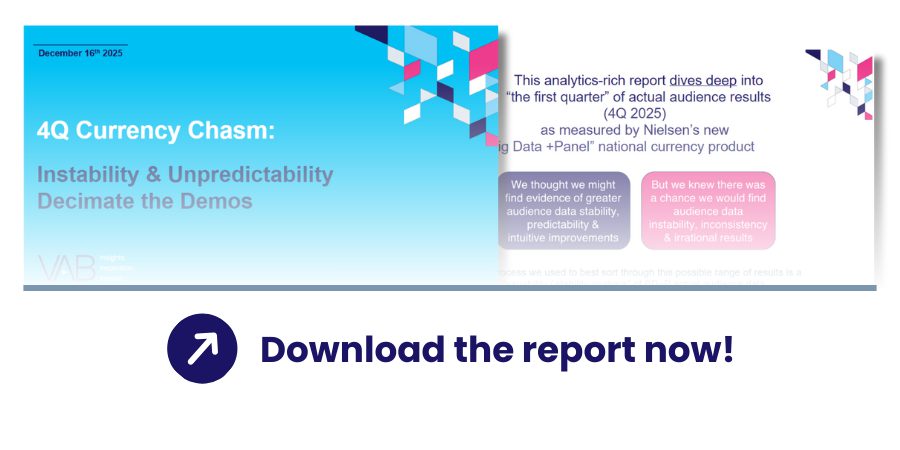
Our latest analysis of one month of live BD+P data across 33 networks shows clear signs of instability - especially in the critical P18-34, P18-49 and P25-54 demos that drive the majority of TV trading.
Taking a deeper dive into the NFL specifically exposes even more dramatic volatility. This report shows you why it matters.
You'll learn:
- How BD+P’s demo instability creates undercounting patterns that distort delivery
- The scale of variance across a mix of 33 networks (including broadcast networks, Spanish language networks, cable entertainment networks, cable sports networks, cable news networks and more)
- Why the NFL data, despite massive viewership, shows dramatic fluctuations
- How these inconsistencies impact guarantees, planning inputs, and valuation
- What this means for marketers relying on accurate, stable measurement
Why Download?
Get the data, visualizations, and real-world examples revealing why the current BD+P measurement may not be suitable as a trading currency. Learn what instability looks like in practice - and what it means for billions of guaranteed dollars across the marketplace.
Get Immediate Access To Our Content


You have questions. We have answers.
Get immediate access to our Insights library.