
Stay up to date with VAB’s 10 must-see charts of Q2.
You’re busy, so we’ve summed up our most popular insights content this quarter. In 10 charts, see what’s hot in marketing right now.
Download to find the latest charts on:
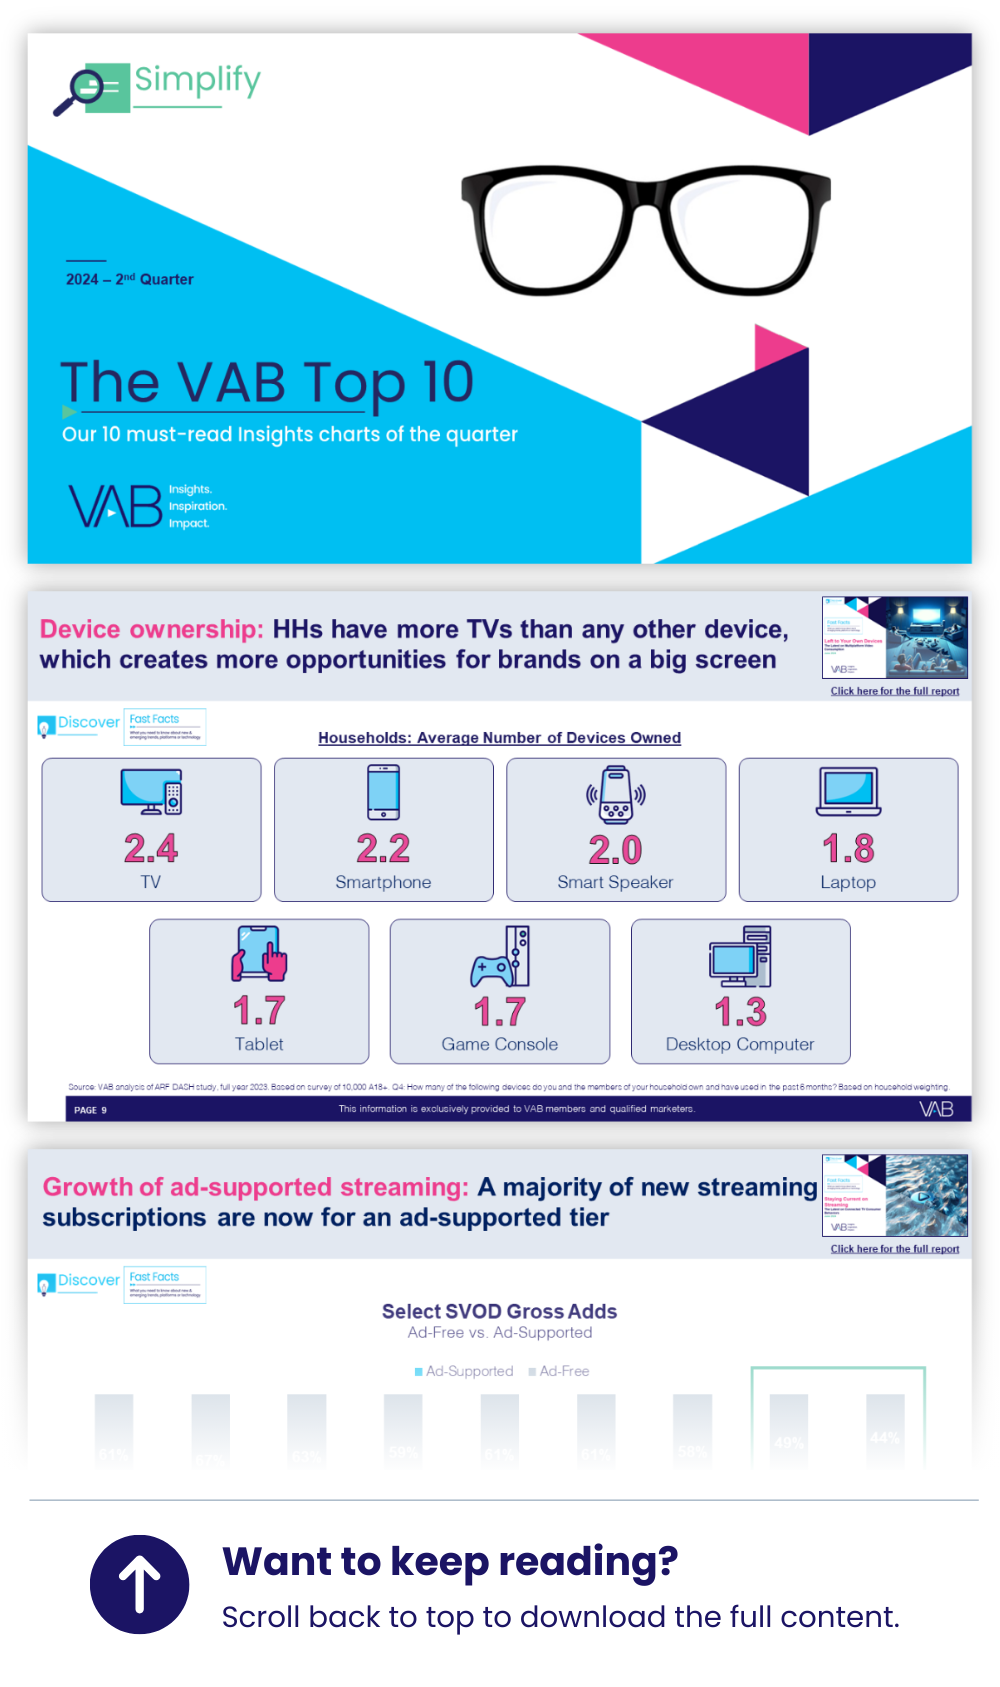
- Device ownership: Households have more TVs than any other device, which creates more opportunities for brands on a big screen.
- Growth of ad-supported streaming: The majority of new streaming subscriptions are now for an ad-supported tier.
- New TV advertisers: Despite economic uncertainty in 2023, more dollars were invested by new advertisers than in the last 5 years.
- Gen Z consumer behavior: While P16-34 enjoy social videos, over two-thirds spend more time with long-form content.
Did you download this and want more? Great! To dive deeper on any of the charts, click the report thumbnail on the top right of the slide to unlock the full reports.

Get Immediate Access To Our Content


You have questions. We have answers.
Get immediate access to our Insights library.