
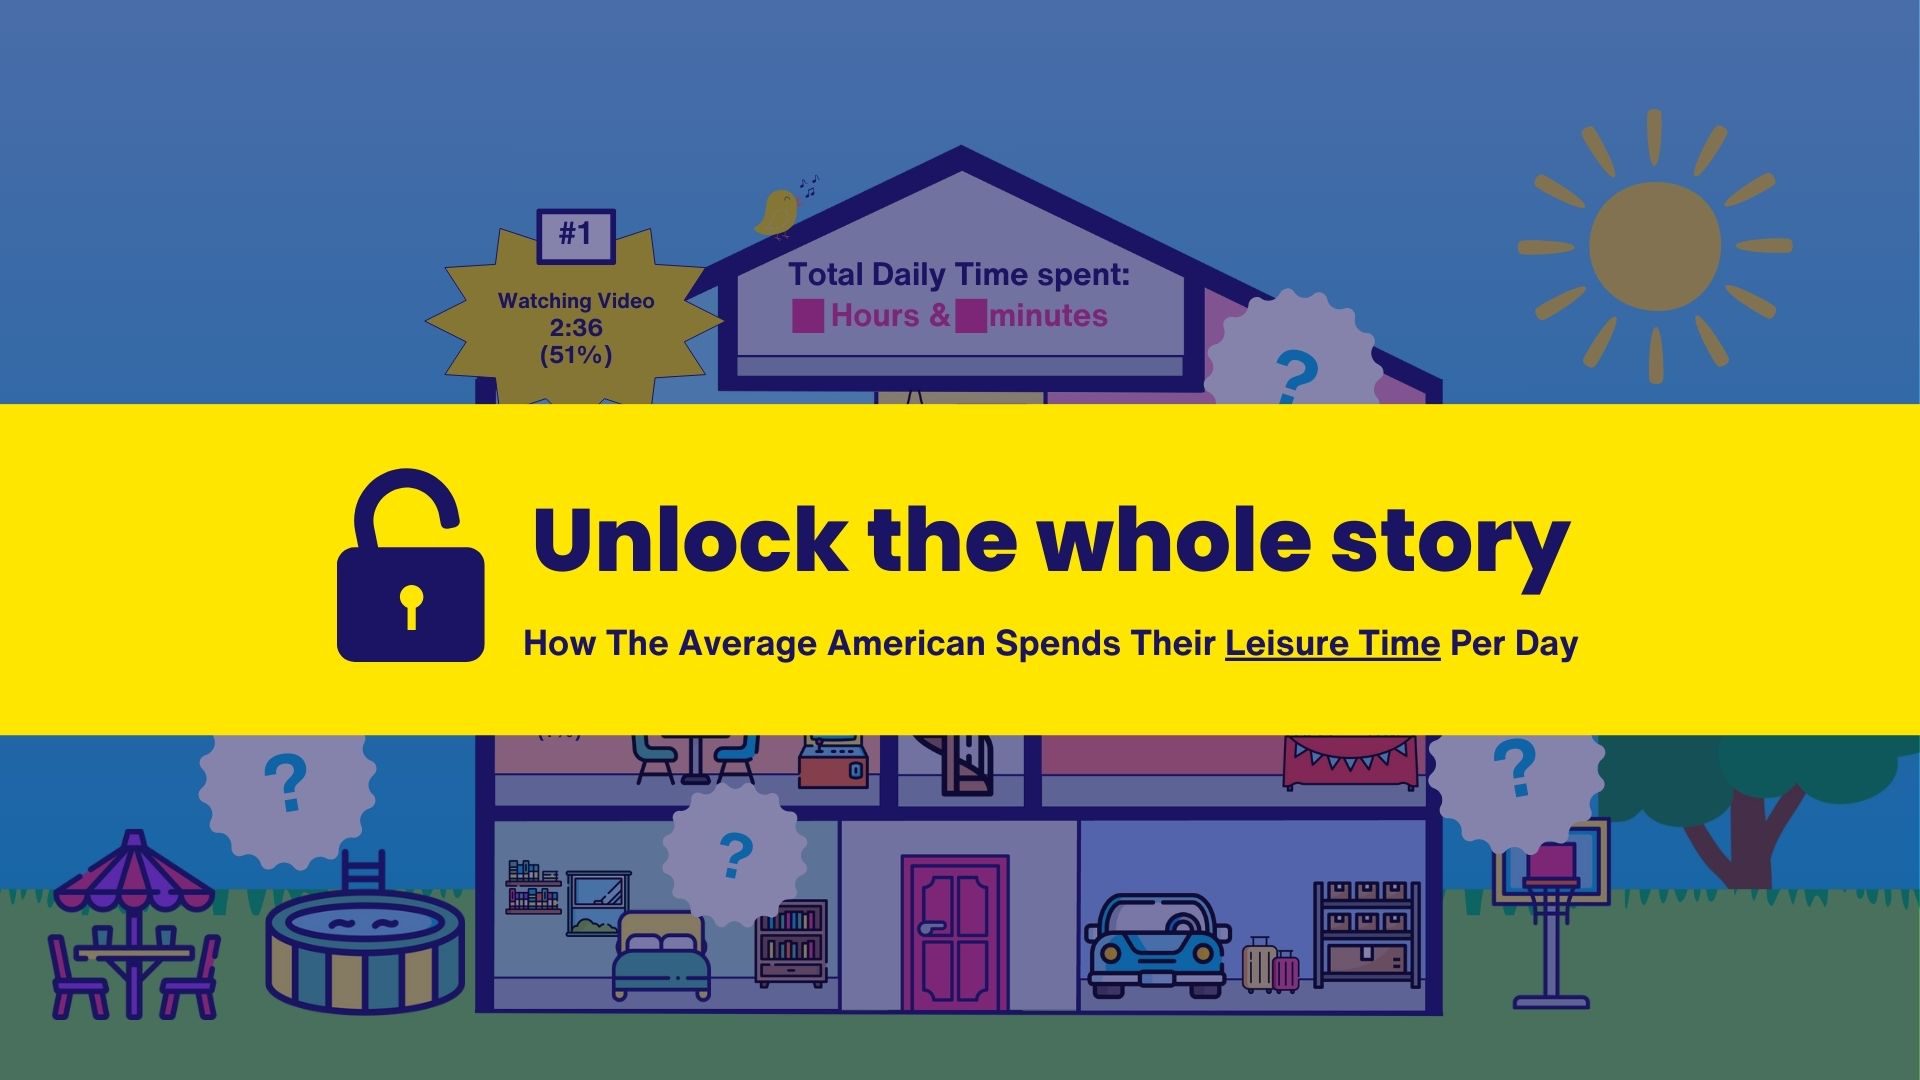
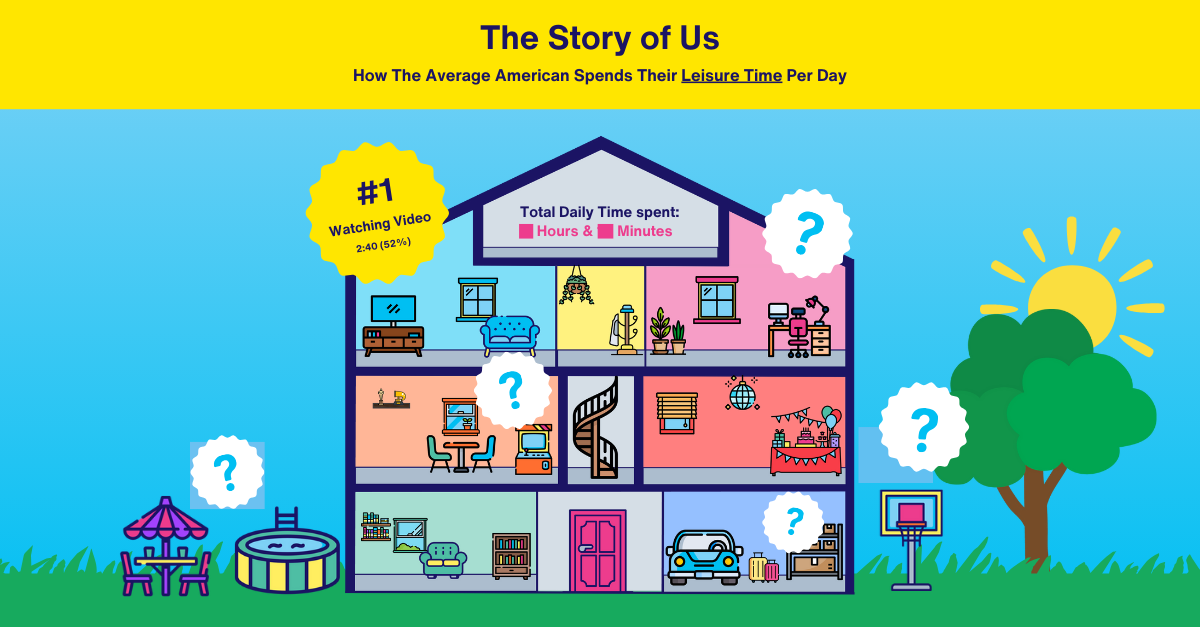
We have the latest data on how Americans like to spend their free time. (Hint: Watching video is #1.)
The Bureau of Labor Statistics just released new data from their American Time Use Survey for 2024. Continuing the trend from 2023, Americans spend more than 50% of their daily free time watching video.
Want to see how sports, gaming, travel, and more stack up? Discover the average minutes spent on each activity and the percentage share of overall leisure time. Get the full story with this simple infographic.
Get Immediate Access To Our Content


You have questions. We have answers.
Get immediate access to our Insights library.